Expanded Tier 1 + Tier 2 biomarker interaction mapping
Maps how a broader marker set interacts across vascular, metabolic, hepatic, renal, recovery, and longevity systems.
 EXIABIO
Best for users who already have broader biomarker data and want stronger cross-marker interpretation across metabolic, vascular, endocrine, recovery, inflammatory, and nutrient systems.
Not sure if your report fits? Use the report suitability self-check before joining early access.
Deep Map applies the Sentinel Logic Engine across your expanded biomarker set — reading markers together, not in isolation. The example below shows how overlapping patterns across multiple markers combine into a single friction classification.
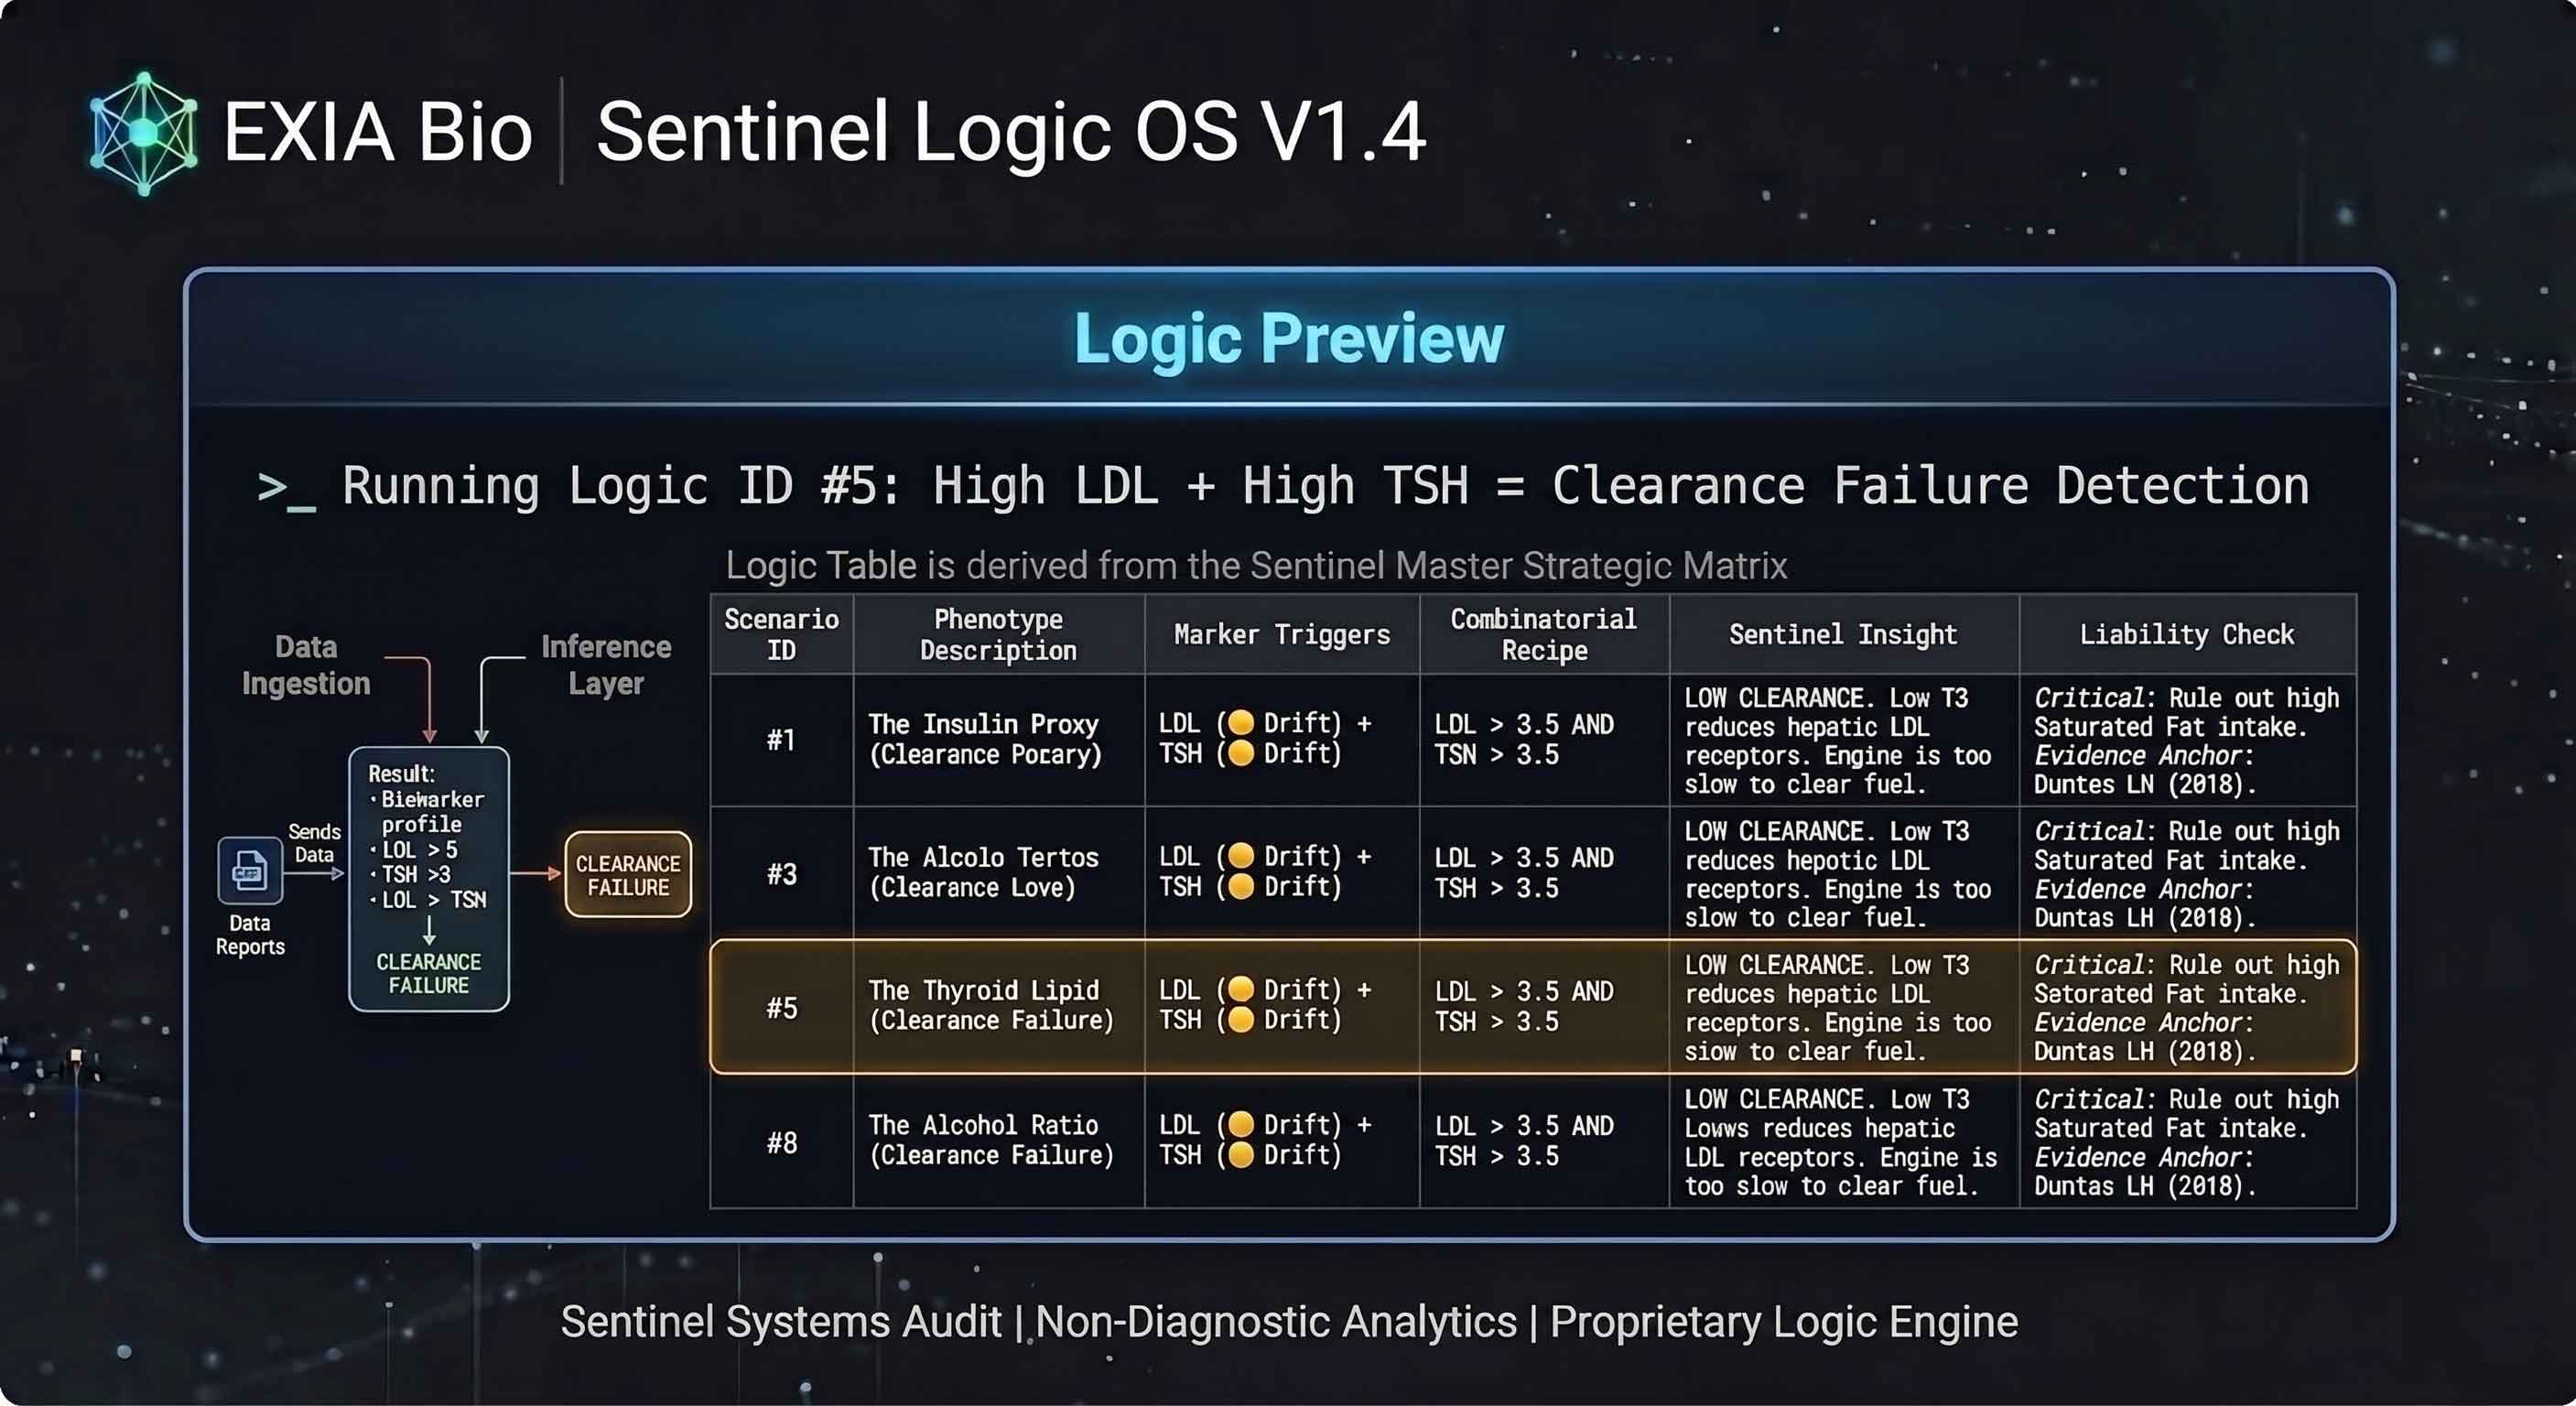
Sentinel Logic OS — Logic Preview showing how overlapping marker patterns trigger friction classification. This reflects the analytical approach Deep Map applies across your Tier 1 and Tier 2 data.
A richer system map when your report contains both Tier 1 and Tier 2 markers. Deep Map is for users whose reports contain enough marker depth to support fuller Sentinel interpretation across baseline signals, deeper endocrine/metabolic markers, and pathway-specific friction.
Current public access is based on customer-provided reports. Partner-supported collection pathways are not currently active.
Deep Map uses Tier 1 biomarkers plus any available Tier 2 markers to produce a deeper interaction map, stronger missing-signal review, and pathway-specific priority stack.
The output is educational and analytical. It does not diagnose disease, prescribe treatment, or replace licensed medical consultation.
Maps how a broader marker set interacts across vascular, metabolic, hepatic, renal, recovery, and longevity systems.
Classifies each system as stable, drifting, friction-loaded, or constrained — beyond a binary normal-or-abnormal read.
Flags every interpretation area where missing markers reduce confidence, so the dashboard is honest about its limits.
The priority stack is recalibrated against the pathway you select, so the same data points different directions for different goals.
The dashboard is structured to be compared against future uploads rather than read once and filed.
Each Deep Map dashboard is reviewed for obvious report-reading and completeness issues before release.
Exact coverage depends on report or collection availability. Missing markers do not automatically prevent the flow, but they affect confidence and follow-up recommendations.
The same biomarker can carry different weight depending on the goal. You may choose executive performance, training and recovery, metabolic body composition, and longevity and resilience, or overlapping pathways.
Friction that may affect energy stability, cognitive load, recovery reserve, and output consistency.
Glucose, lipid, liver, thyroid, inflammatory, and hormonal signals that may affect body composition and recomposition.
Recovery load, tissue stress, iron/oxygen transport, endocrine support, and systemic strain patterns.
Early system offset across metabolic, vascular, inflammatory, renal, liver, and hormonal systems.
01
Request launch access for the selected Sentinel product. Payment details will be confirmed during onboarding.
02
Use the private link to upload your report, choose pathways, and confirm consent.
03
The system reads the report, maps available markers, and Exia Bio performs launch-stage quality checks.
04
You receive a secure dashboard link showing scores, system resistance, missing signals, and priorities.
If your report has Tier 1 coverage but lacks the advanced markers needed for your goal, Sentinel Signal Unlock can define the highest-value Tier 2 completion path.
Yes. Missing markers do not automatically prevent analysis, but they reduce confidence in specific interpretation areas. The dashboard will show missing signals and limitations clearly.
The core output is a secure dashboard link because the dashboard is designed for follow-up comparison, continuity tracking, and priority refresh.
Exia Bio does not diagnose or treat medical conditions. If a result appears outside the context Exia Bio is designed to explain, users should share their original laboratory report and Exia Bio dashboard with a licensed healthcare professional.
Yes. Many users have overlapping goals across executive performance, training and recovery, metabolic body composition, and longevity and resilience. The selected pathways help Exia Bio calibrate dashboard priorities.
Private intake links will be issued during launch onboarding.
Baseline Analysis reads the Tier 1 markers in your existing report and structures them into a first-pass dashboard. Deep Map includes expanded Tier 1 and Tier 2 marker mapping — it interprets how a broader set of biomarkers interact across multiple biological systems, providing a more detailed multi-system view.
No, but their presence improves interpretation depth. If your report includes advanced markers such as ApoB, fasting insulin, hs-CRP, SHBG, ferritin, vitamin D, or omega-3 index, Deep Map will incorporate them. If they are absent, the dashboard will note which markers are missing and how this affects confidence.
Deep Map can be purchased independently. If you have already completed Baseline Analysis and want a more detailed interpretation, Deep Map is a natural next step. If you are starting fresh with a report that already includes Tier 2 markers, Deep Map is the better first choice.
Target release within 72 hours after complete intake and usable report upload, once launch onboarding and payment confirmation are complete. Turnaround may occasionally vary during the early access period.
No. Exia Bio does not provide medical advice, treatment plans, supplement prescriptions, or dietary recommendations. Deep Map surfaces analytical patterns and friction signals for educational review. What you do with that information — including whether to consult a healthcare professional — is your decision.