Pathway: Executive Performance
Executive Performance
Looks for friction that may affect energy stability, cognitive load, recovery reserve, and output consistency.
 EXIABIO
This page is for customers and first-time visitors. It shows what YOU do and what YOU receive — from confirming your report pathway to opening your dashboard.
Report data
Marker structuring
Pathway calibration
Dashboard output
Continuity refresh
From static report to structured biomarker intelligence.
Exia Bio uses illustrative output logic to organize biomarker context, tracking priorities, and future comparison points. This visual is not the final customer-facing output.
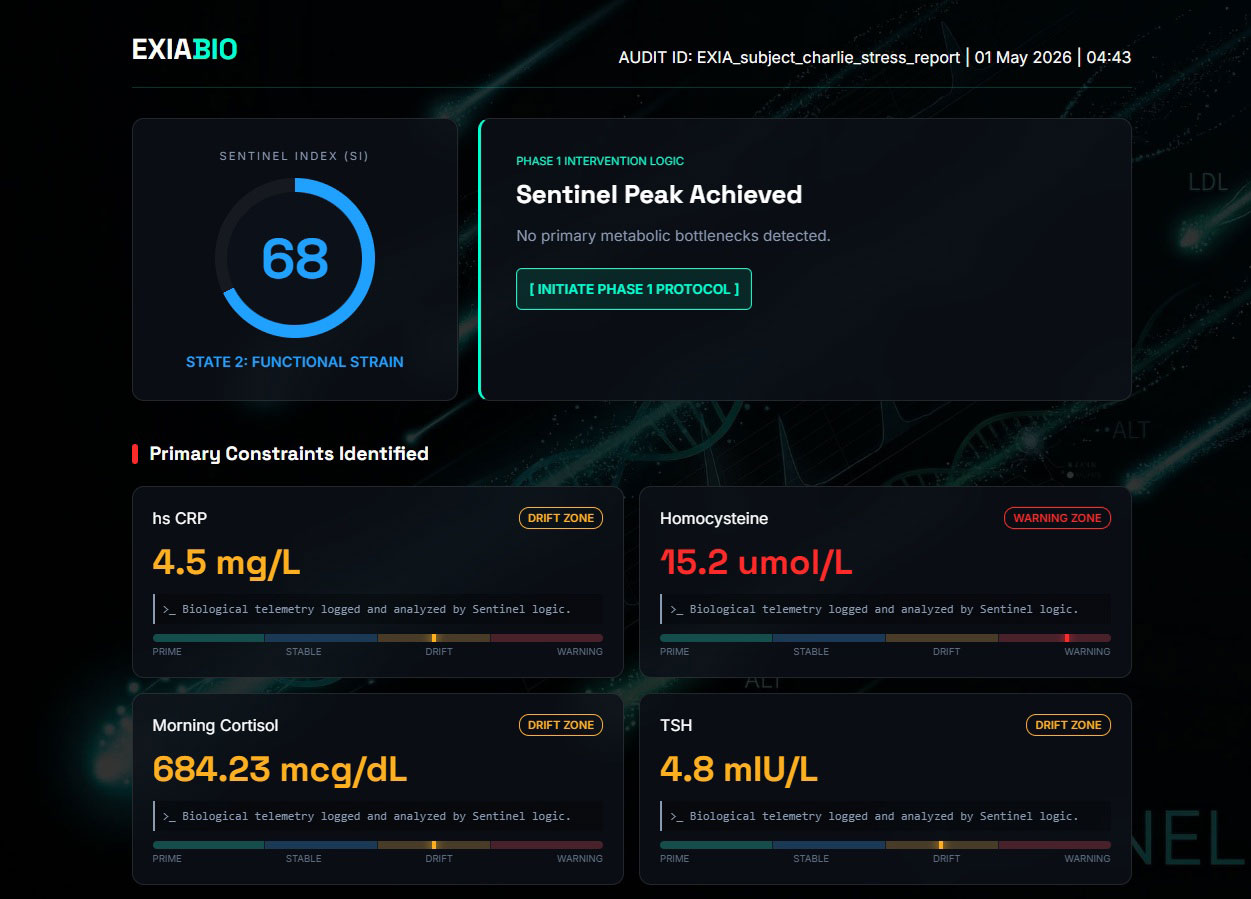
Exia Bio calibrates interpretation around the pathway you select. A marker that matters for executive performance, training and recovery, metabolic body composition, or longevity and resilience may carry different weight depending on your goal and context.
Want to understand the multi-zone calibration engine behind this? See Technology →
Pathway: Executive Performance
Looks for friction that may affect energy stability, cognitive load, recovery reserve, and output consistency.
Pathway: Training & Recovery
Maps recovery load, tissue stress, iron/oxygen transport, endocrine support, and systemic strain patterns.
Pathway: Metabolic & Body Composition
Focuses on glucose, lipid, liver, thyroid, inflammatory, and hormonal signals that may affect body composition and recomposition.
Pathway: Longevity & Resilience
Tracks early system offset across metabolic, vascular, inflammatory, renal, liver, and hormonal systems before patterns become easier to see in standard reports.
A PDF is useful for one-time documentation. Exia Bio is designed for a longer loop: current state, missing signals, pathway priorities, future uploads, and progression over time.
One view
Scores, friction zones, missing markers, and pathway priorities are shown together instead of scattered across pages.
Reusable
The dashboard model supports follow-up results and trend interpretation after future screening or re-testing.
Clearer
Users do not need to interpret every marker alone. The dashboard emphasizes the systems that most deserve attention.
Controlled
Before launch automation is fully mature, structured review helps reduce obvious report-reading and completeness errors.
The process moves from your existing blood data to a structured dashboard without asking you to decode every marker yourself.
Submit your existing blood report or, where available, use a partner-supported collection pathway. Select the pathway that matches your goal — Executive Performance, Training & Recovery, Metabolic & Body Composition, or Longevity & Resilience.
Your markers are structured and interpreted across biological systems — not reviewed one value at a time. Friction patterns, missing signals, and optimization priorities are mapped.
Typically within 72 hours of complete upload and intake, your dashboard is released — showing your Efficiency Score, system priorities, missing-signal gaps, and a comparison baseline for future uploads.
Curious about what Sentinel is doing to your data behind the scenes?
See the Technology arrow_forwardUnderstanding Exia Bio — three levels of depth
Your Experience
How It Works
You are here
Choose a product pathway based on your current report status, missing markers, or need for a fresh partner-supported collection, where available.